
Data Heart
Interactive data visualisation breathes life into real-time transactions.
- New York, USA


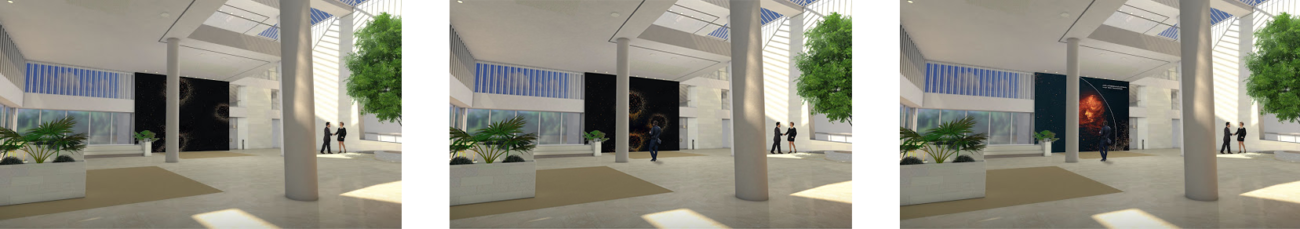
While real-time work has largely been restricted to one-off marketing and at-home experiences, it represents a powerful tool for engagement in corporate spaces. Responding to this opportunity, Data Heart is an experiential marketing activation that transformed the lobby of a New York technology services company into a permanent interactive artwork. Bringing together real-time company data, passive visitor tracking and dynamic particle visualisations, the work shows how emerging technology can shape brand perception and engagement in commercial settings.
Embodying innovation
The IdeaCorporate lobby spaces present a distinct opportunity for companies to create an impressive and insightful first impression of their brand. Working with a technology company headquartered in New York, we developed a data-driven interactive installation to capitalise on this opportunity. The resulting experiential marketing activation, Data Heart, was an engaging and insightful experience for visitors and employees that helped to frame their perception of the company.
Digital extends the physical
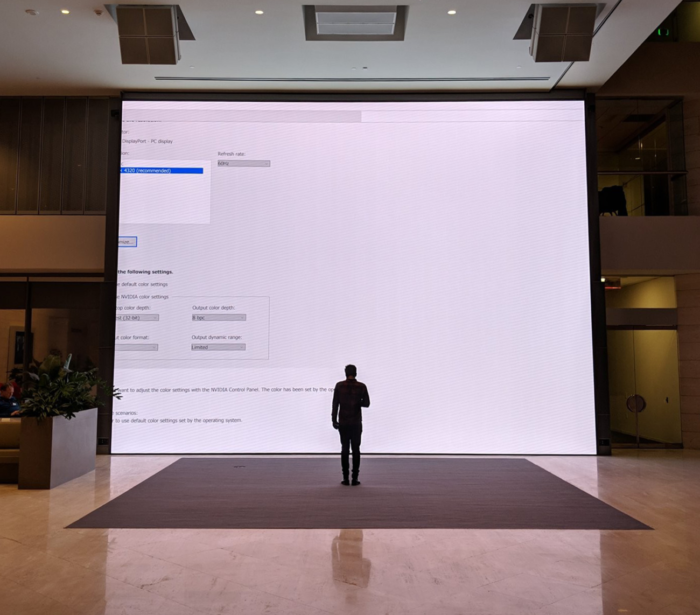
Immersive SpacesEmphasising our client’s dedication to innovation and technology, Data Heart capitalised on the scale of the lobby space through a huge 9x6m interactive LED wall and dynamic spatial sound system. Designed to be both visually impactful on its own and delightfully responsive to visitors, the creative technology installation served as both a physical artwork and a point of digital interaction that connected human experience with innovative technology.

Cross-disciplinary understanding
CollaborationLike with so much of our work, Data Heart was made possible by our team’s cross-disciplinary nature. Throughout development, artists and programmers worked side by side to establish the systems we would need to tie the project together. Working across multiple languages, frameworks and softwares, the team needed to communicate seamlessly and work flexibly in order to create a satisfying and permanent experience.
The project also necessitated close collaboration with the client. Working on real-time executions in a commercial context brought with it many challenges that influenced our creative and technical decisions. We also adopted a process of rapid iteration as we worked closely to translate their creative requirements into a beautiful and robust experience system.
Levels of engagement
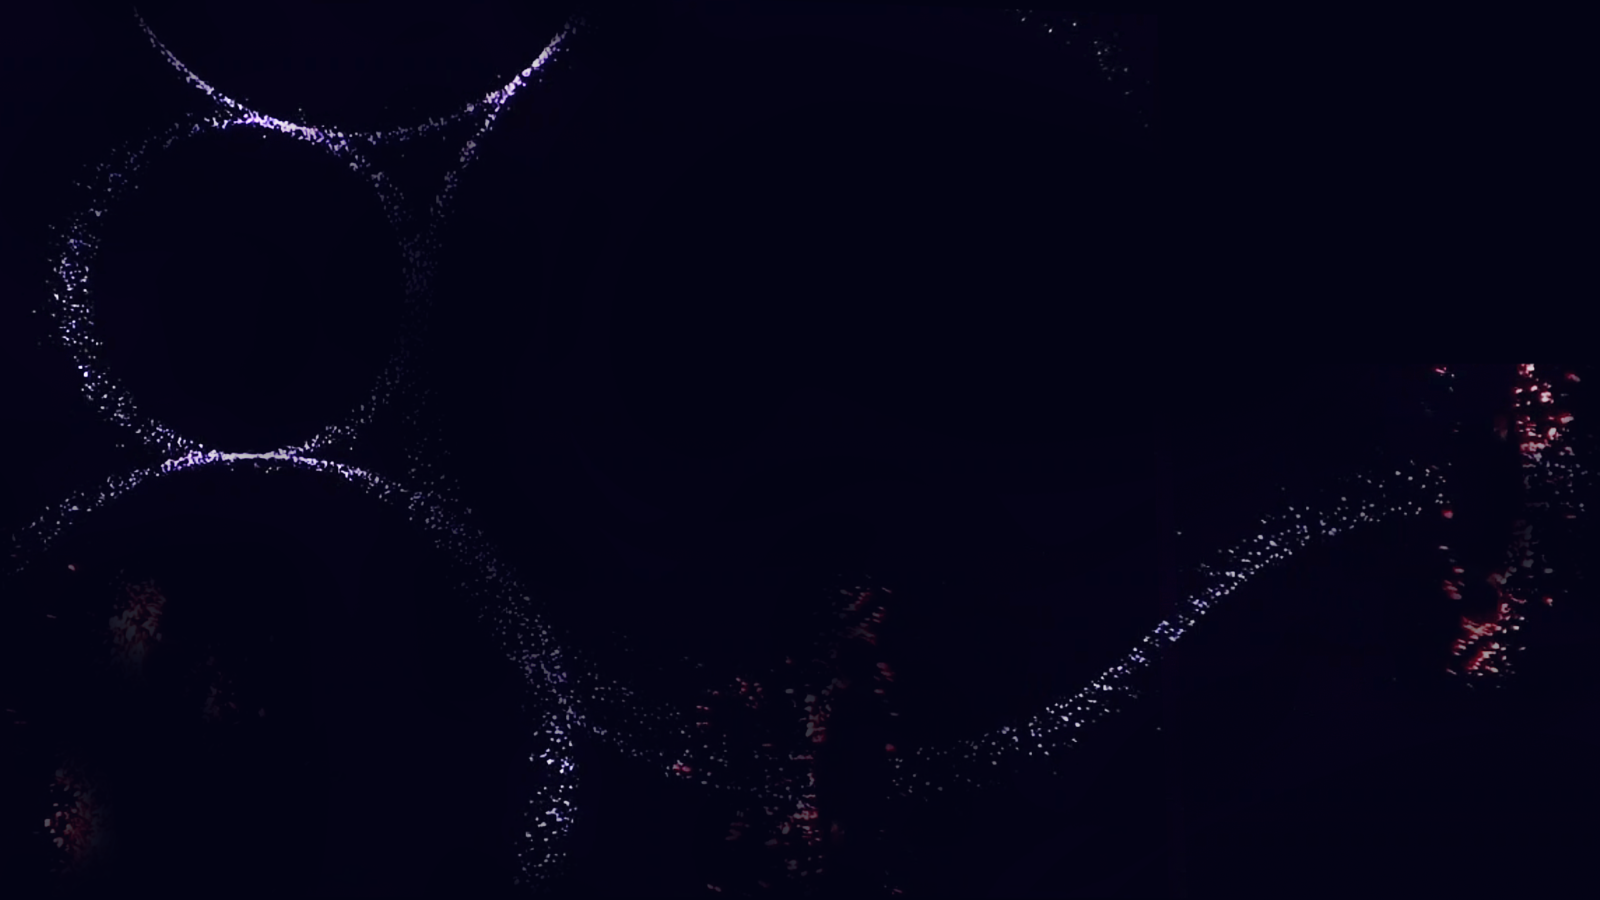
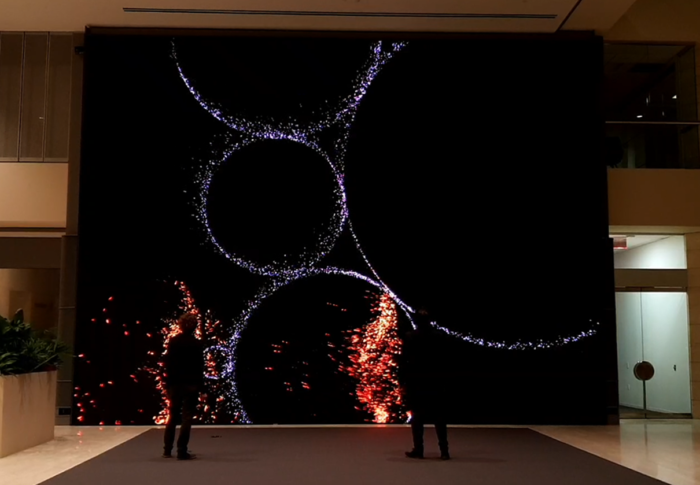
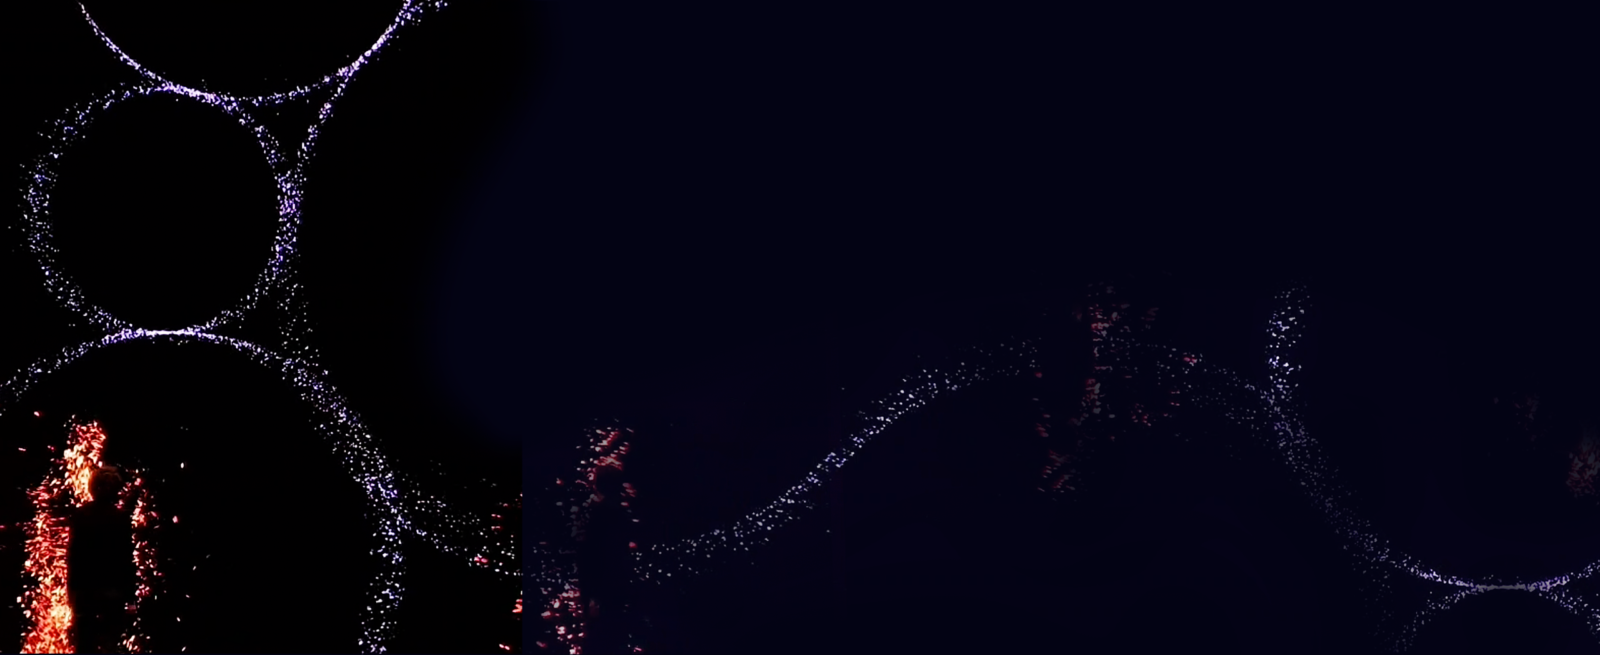
User ExperienceAiming to give audiences a beautiful and meaningful way to explore our client’s data-driven company, we designed Data Heart to engage visitors at three levels: visual impact, delightful interaction and insight generation. First, the activation’s ambient state drew visitors towards the experiential marketing installation through a beautiful, high-impact particle visualisation as circles of different hues and sizes moved slowly and meditatively across the LED screen.
When visitors entered the interactive zone, they triggered the activation’s interactivity as the circles – and the underlying soundscape – began to react to their presence and movement. When a visitor’s circle met another, the data visualisation flared with energy as the next and final state was triggered. At this point, particles throughout the creative technology installation transformed into an image representing an ‘insight’ from our client’s vast data sets.
Individual + group interaction
InteractivityPositioning visitors as ‘catalysts’ for the data visualisation was crucial in driving meaningful brand experiences. Given the size of the lobby space and the corporate context, we ensured that the experiential marketing installation could facilitate not only individual but group interactions. This choice, to allow an unlimited number of visitors to interact, helped us to push the limits of what real-time interactive experiences could look like in a commercial space.
Facilitating this interactivity required a complex system of visitor tracking, real-time technologies and responsive design. First, visitor data was captured through RealSense cameras and HIKVision security feeds. This data was then fed into an array of web technologies including Notch, OpenFrameworks and MaxMSP. Finally, the impact of visitors’ interaction was communicated back to them through the 5k LED wall and positional audio setup.
Real-time visitor tracking
Computer VisionVisitor tracking in Data Heart consisted of two computer vision systems. The first used wide FOV cameras – HIKVision security feeds – placed strategically throughout the lobby to analyse user movements according to time of day. This data about current activity in the lobby was then used to influence the intensity of particle simulations in the data visualisation as well as where the positional audio system should focus.
The second system used an array of Intel RealSense D435 cameras to map the area directly in front of the LED wall into a 3D point cloud. With this information, we could work out the proximity of visitors to the screen and to each other, as well as generating a 2D silhouette of their shape. We then translated this data into subtle representations of users within the visualisation as ‘particle emitters’ whose particles contributed to data insights.

Giving data meaning
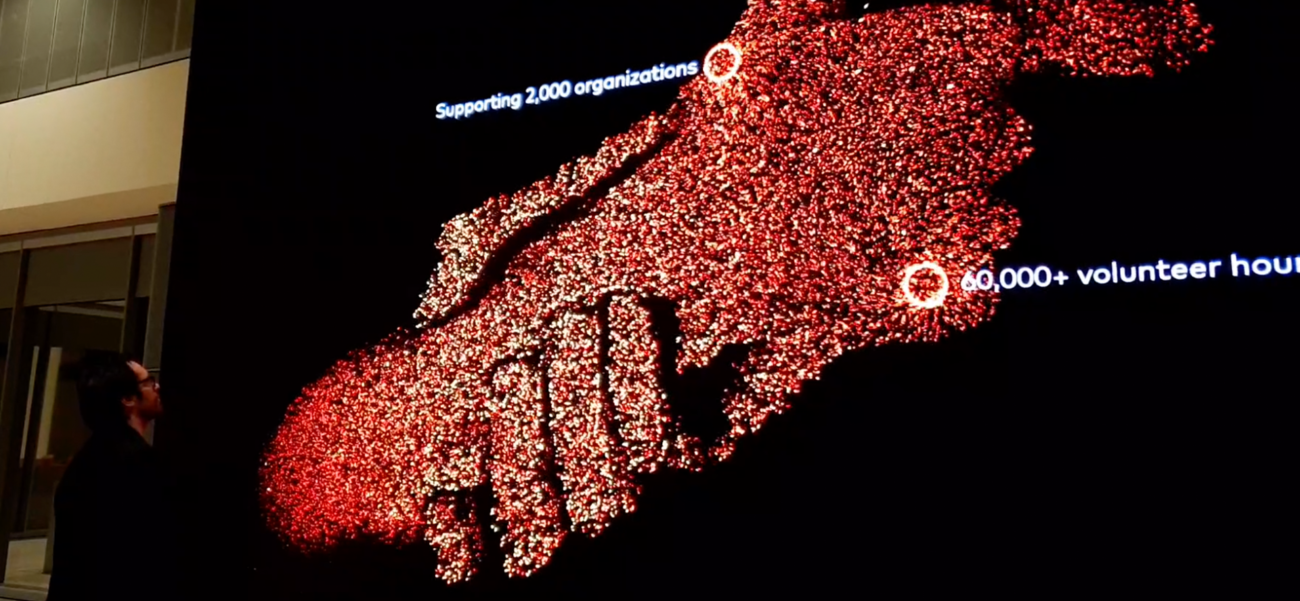
Data VisualisationAt its core, Data Heart was about giving audiences meaningful insight into our client’s data. We did this in two ways. First, in the installation’s ambient state particles were emitted at a rate of 2,346 per second and with a lifespan between 0.8 and 18 seconds to reflect the average rate of data collection. This subtle and abstract representation of data gave the creative technology artwork substance and momentum even in its passive state.
The second method of data visualisation was through ‘insights’ into the datasets themselves. Triggered by visitor engagement, these insights would form existing on-screen particles into a dynamic visualisation representative of a key data point. Providing visitors with a window into our client’s data, these visualisations helped us to not only give meaning to the data but to form a connection between audiences and the brand.


Interactive audio composition
Spatial AudioWhile many corporate installations focus almost exclusively on visual attraction, audio played a key role in Data Heart. For this experience, music and sound were positioned as another lens – alongside the visualisation – through which to connect with the data. The challenge was to take our client’s existing audio brand and transform it into a breathing interactive soundscape that would complement and enhance the overall experience.
In this case, we were lucky enough to have access to a sophisticated spatial sound system throughout the activation space. We took advantage of this in a number of ways, particularly to signpost different states of the creative technology experience. For example, a ‘welcome’ audio sequence to trigger whenever a visitor passed by a defined area near the entryway, drawing their attention to the experiential marketing installation as on-screen animations reacted to their presence.
We continued to use audio throughout Data Heart to enhance both data visualisation and visitor interactions. The underlying atmospheric track used the density of particles on-screen to determine the overall flow of the music. Meanwhile, new notes were added to this soundscape based on visitor interaction, helping to signal their relationship with and impact on the overall installation.

Designing for permanence
Permanence + Stability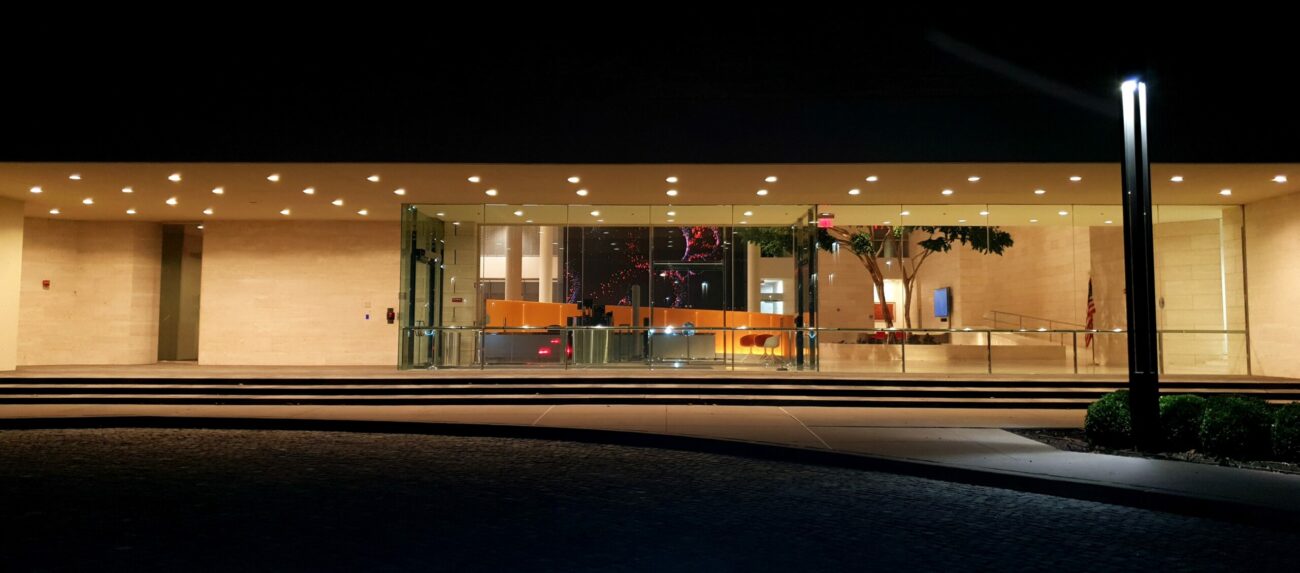
Given that the final experiential marketing activation was operational nearly 24 hours a day, the stability of the underlying system was of the highest priority. Due to the complexity of the installation, we made sure to integrate numerous redundancies and graceful fallbacks into the system in case anything went wrong. This included installing additional cameras and providing extensive documentation to ensure that every potential failure could be fixed quickly and easily.
A commercial future for real-time installations
Future PotentialMost real-time work is designated to one-off performances or at-home experiences. By bringing this technology into a corporate space, Data Heart shows how creativity and code can be used in permanent commercial settings. Beyond being a stunning installation in its own right, the experiential marketing activation demonstrates how creative technology can be a powerful tool for commercial clients to foster meaningful, memorable experiences with their audiences.
See more projects
Explore projects similar to Data Heart.
-
TYAMA Exhibition Melbourne
Multisensory experience reveals new perspectives through interactive story.
-

The Future Water Story
Collaboration + interactivity put young people at the centre of our water story.
-
Terracotta Warriors
Immersive experience sets the scene for WA Museum’s boldest exhibition.
-

Japan Supernatural
Interactive touch wall brings historic masterpiece to life.
-
MOD. Beginnings
Immersive + interactive experiences bookend cornerstone MOD. exhibition.
-

Brian Robinson Collaboration
Immersive projection transforms leading First Nations artwork.
-

MGM Spa Digital Immersive
Dynamic content + real rainfall create immersive wellness experience.
-

vivo Lab
Immersive experience centre rediscovers the magic of photography.
-

Into the Blue
Immersive video animation reveals the vibrant world of the Indian Ocean.
-

Antopia
Immersive exhibition reveals the secret world of ants at Melbourne Museum.
-

World Expo Interactive Projection
Experience the story of a lifetime in the world’s largest interactive projection.
-

Super Wings Fly With Me
Interactive exhibition takes families on a tactile and immersive quest.
-
Macau Grand Prix Museum
Next generation museum experience explores the vibrant world of racing.
-

Ignite the Dream
Real-time interactions trigger an iconic Disney fireworks show.
-

Underground Cities
Interactive virtual environments explore underground infrastructure.
Stay in the loop
Subscribe to our newsletter to receive updates and insights about Data Heart and other S1T2 projects.